Revenue Impact Dashboard
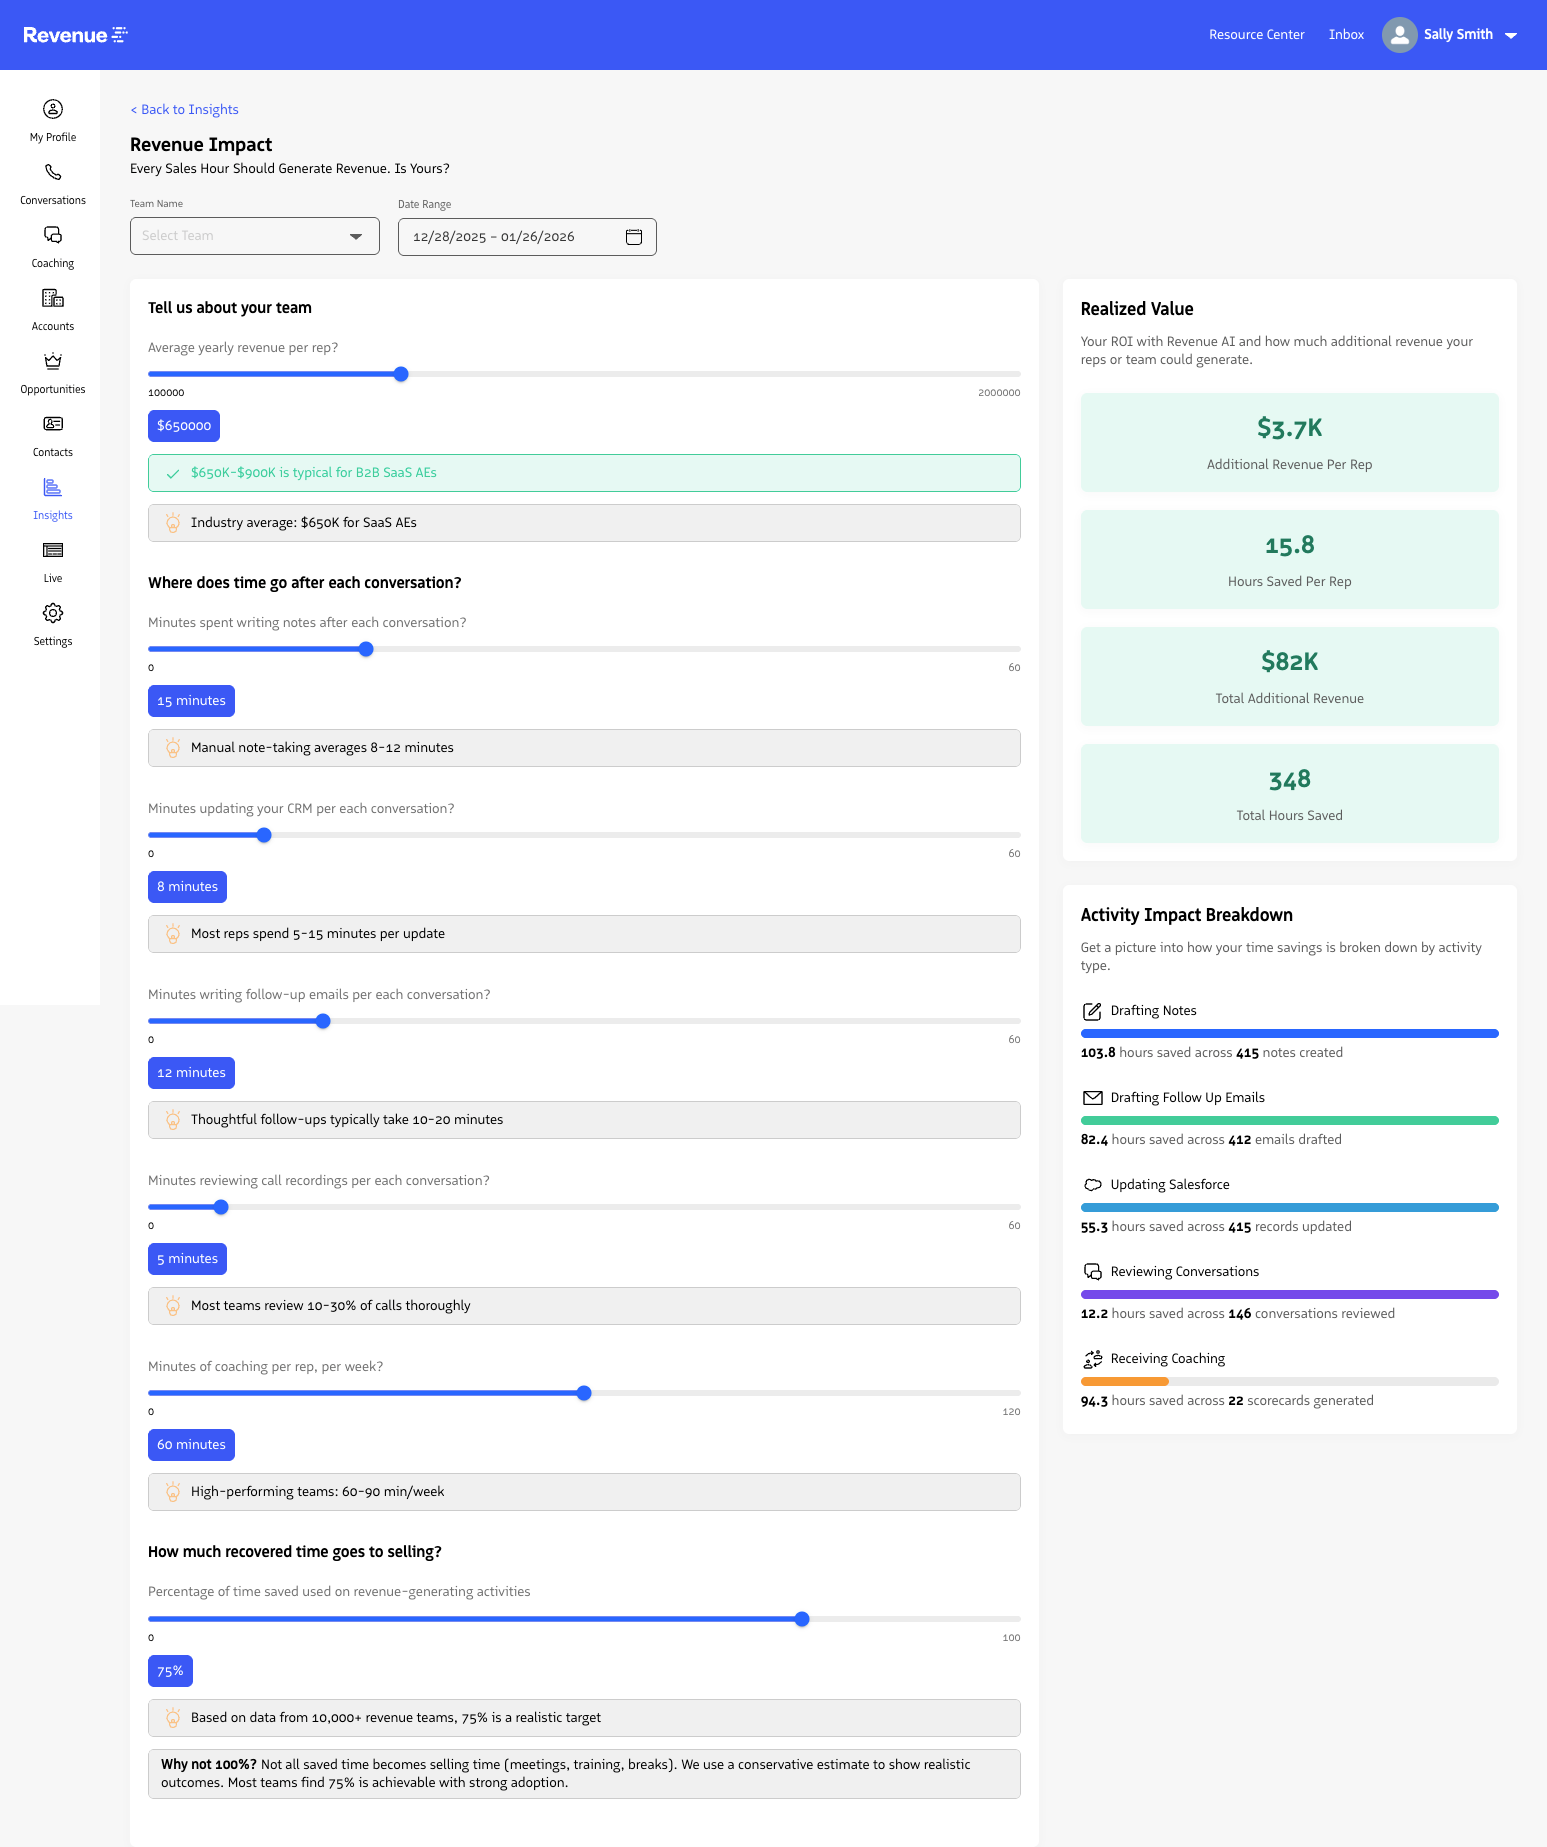
Sales organizations can use the Revenue Impact dashboard to quantify and visualize how generative AI features impact revenue by configuring revenue and activity assumptions, then filtering by team and date.
Filtering your dashboard
You can filter the dashboard by Team and Date to see revenue impact for specific teams across a selected time range.
Configuring your dashboard
You can change the default configurations for realized value and rep activity so the dashboard reflects your company’s revenue and time assumptions.
To configure the dashboard:
- Open the Revenue Impact dashboard.
- In the
Revenue Impact Configurationsection, update realized value and rep activity values. - Click
Save. - Review the updated dashboard metrics.
Last updated on