Opportunity Won/Loss Dashboard
The Opportunity Won/Loss Dashboard helps sales leaders analyze how engagement patterns influence deal outcomes. By comparing activity trends across won and lost opportunities, you can identify behaviors that correlate with higher win rates and improve sales execution.
The dashboard provides visual analysis of opportunity activity, including engagement frequency, activity types, and contact involvement. It also includes generative insights that highlight patterns between sales activities and deal outcomes. The dashboard analyzes closed opportunities so you can explore which engagement strategies are most effective.
Key benefits
Identify winning sales behaviors
Understand how activity patterns—such as number of touchpoints or contacts engaged—affect the likelihood of closing deals.
Improve coaching and enablement
Sales managers can identify activity patterns of top-performing teams or representatives and replicate those behaviors across the organization.
Compare team and rep performance
Quickly evaluate engagement patterns across teams and individual representatives.
Use generative insights to surface patterns
Automatically generated insights highlight correlations between engagement activities and deal outcomes.
Analyze opportunity engagement at scale
Interactive charts and filters make it easy to explore trends across large opportunity datasets.
How to access the dashboard
- Go to
Insightsin the Revenue App. - Select
Opportunity Won Loss.
Permissions
- Available to Admins, Supervisors, and Support roles.
- Agents cannot access this dashboard.
Prerequisite
Enhanced Analytics must be enabled.
Dashboard sections
Won/lost metrics
At the top of the dashboard, summary cards provide a side-by-side comparison of key metrics for won and lost opportunities.
Metrics include:
Won revenue
Total revenue generated from won opportunities.
# Opportunities won
The total number of opportunities that were successfully closed.
Average activities
The average number of engagement activities (emails, phone calls, SMS, video, etc.) associated with closed opportunities.
Average days between activities
The average time gap between engagement activities during the opportunity lifecycle.
Average contacts engaged
The average number of unique contacts involved in activities for an opportunity.
These metrics automatically update when filters are applied.
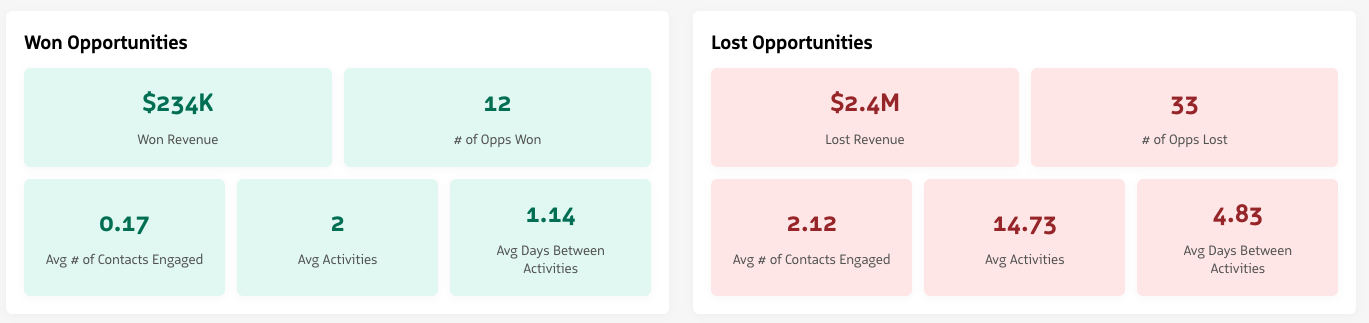
Won/lost metric cards
Generative insights
The Generative Insights section highlights patterns detected between activity behaviors and deal outcomes.
Insights are generated dynamically based on the currently applied filters and opportunity activity data. These insights help teams quickly identify trends such as:
- Activity levels associated with higher win rates.
- Engagement frequency differences between won and lost deals.
- Contact engagement patterns across opportunities.
This section provides quick guidance on which engagement behaviors may influence deal success.
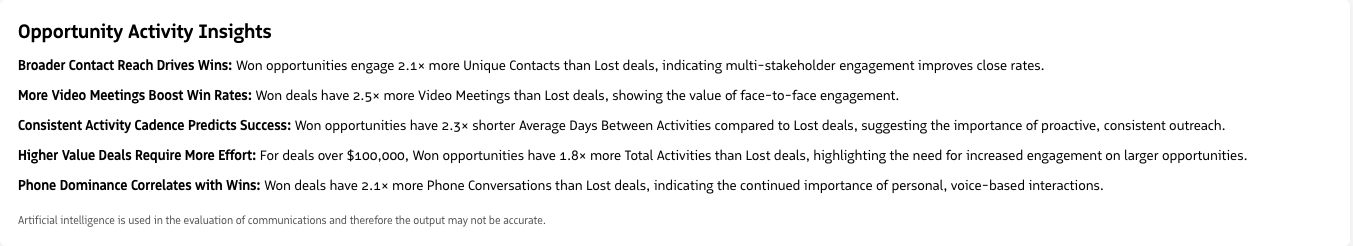
Generative Insights
Activity analysis
The Activity Analysis section uses scatterplots to explore relationships between opportunity value and engagement activity.
Available visualizations include:
Activities per deal
Shows the relationship between opportunity value and the number of activities performed during the deal lifecycle.
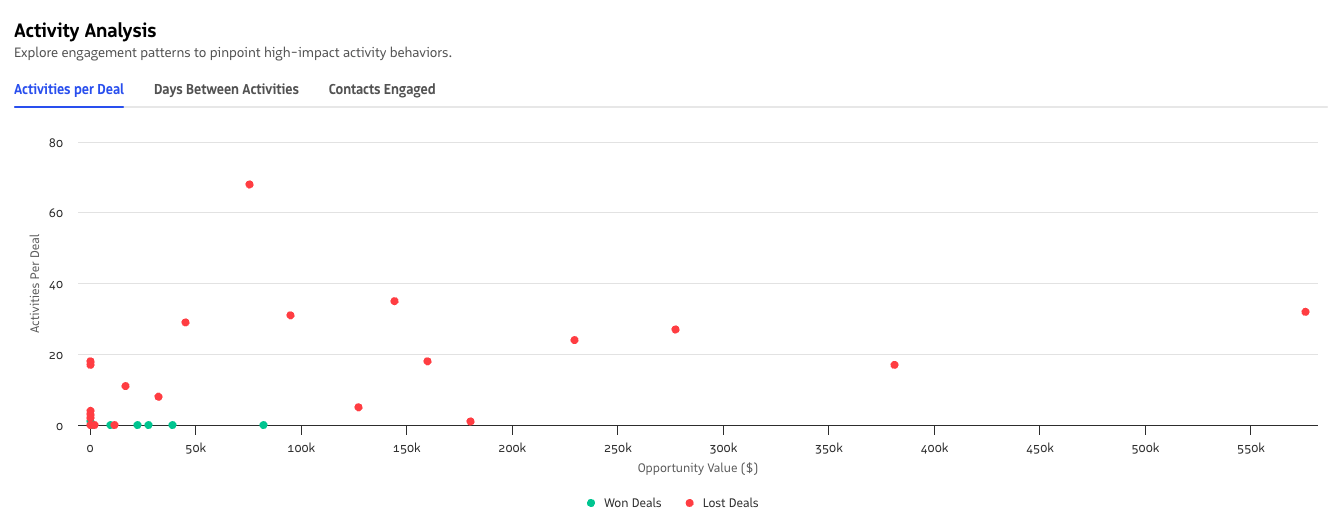
Activities per deal
Days between activities
Shows how the average time between engagement activities relates to opportunity value.
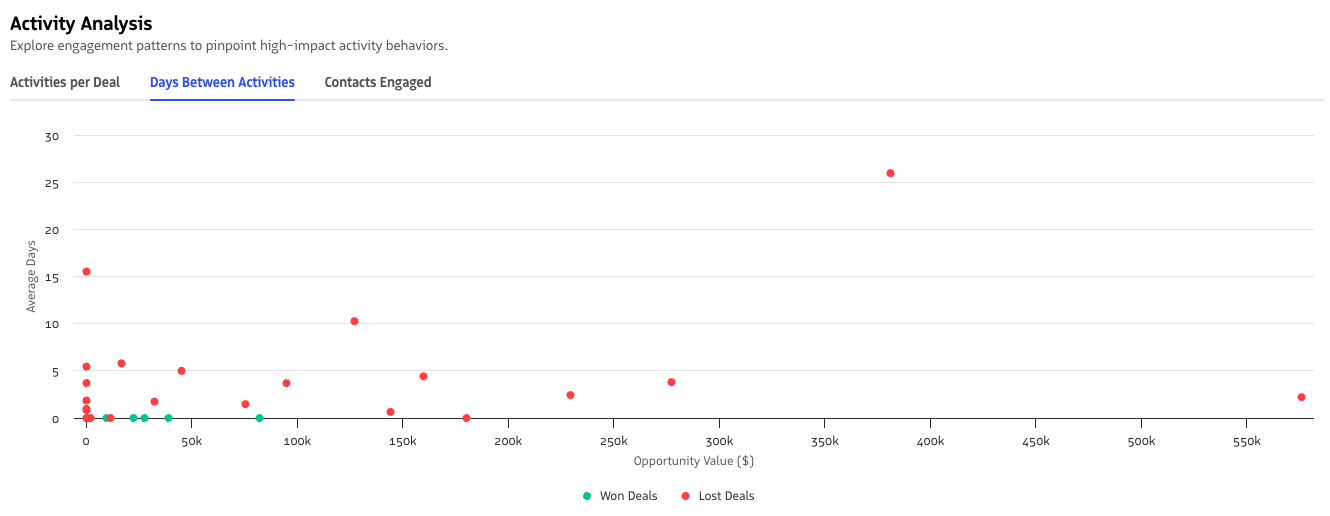
Days between activities
Contacts engaged
Shows the relationship between opportunity value and the number of contacts involved in activities.
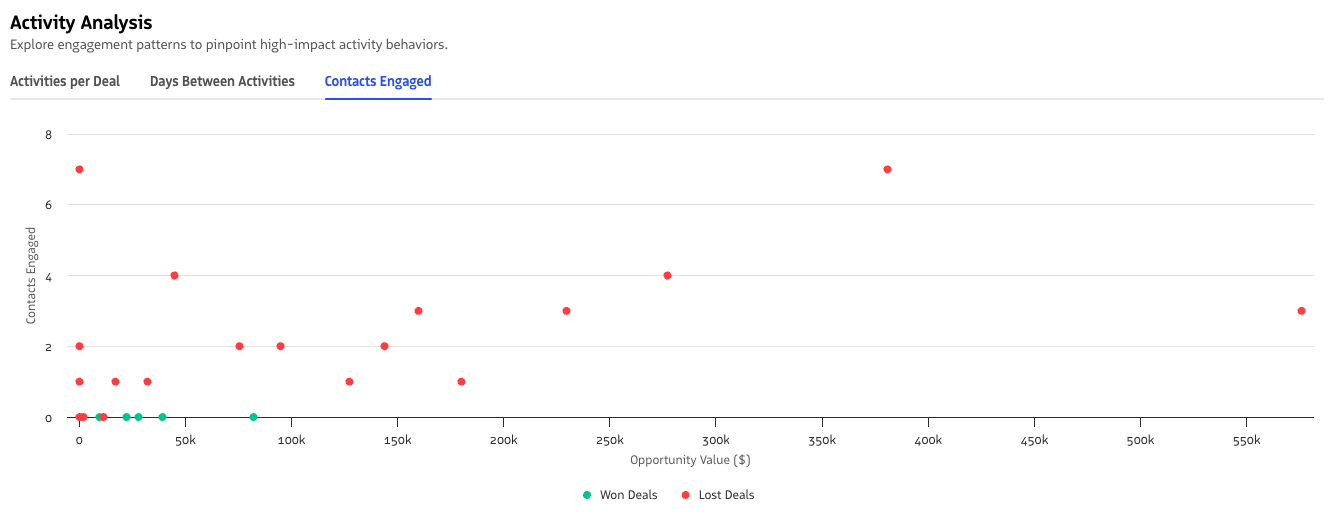
Contacts engaged
Each chart visually distinguishes won and lost opportunities, so you can identify patterns in engagement behavior.
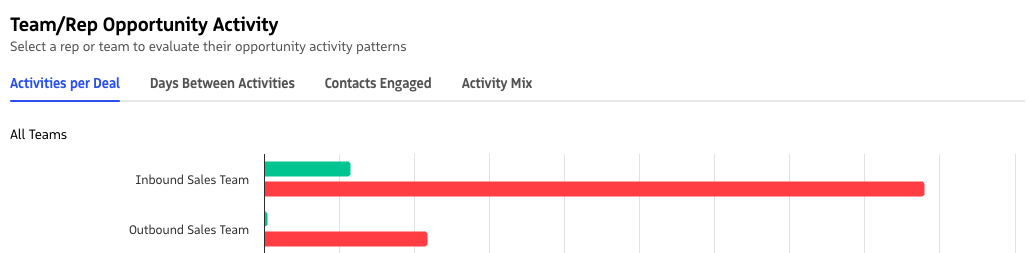
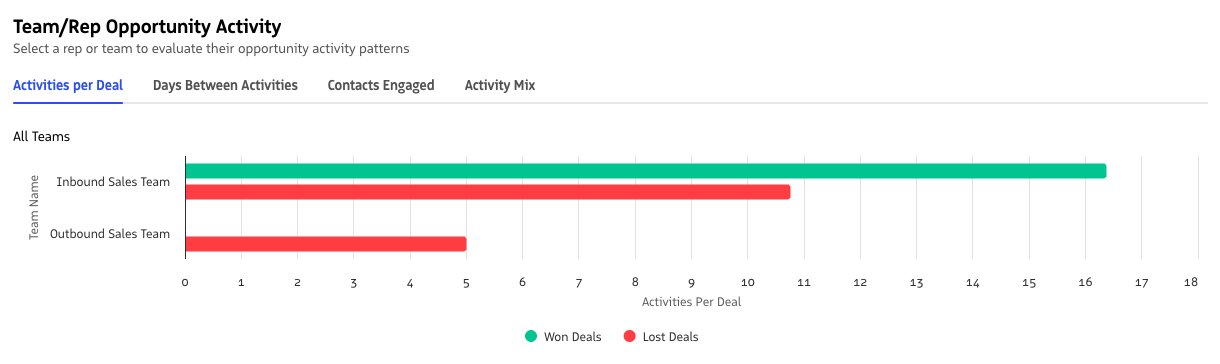
Team and rep opportunity activity
This section compares activity patterns across sales teams and individual representatives.
Charts let you analyze metrics such as:
- Activities per deal.
- Average days between activities.
- Contacts engaged.
- Activity mix across communication channels.
Each bar compares won and lost opportunity activity for a team or rep.
Team and rep opportunity activity
Opportunity details
The Opportunity Details table provides a granular view of individual opportunities included in the dashboard.
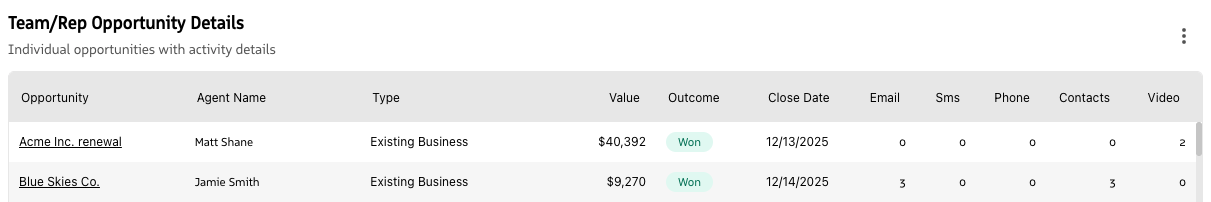
Opportunity Details table
Opportunity filtering
You can click a bar in the Team and Rep Opportunity Activity chart to filter the opportunity details table below.
When a bar is selected:
- The dashboard filters results to the selected team or user.
- The filter also applies the selected won or lost opportunity status.
- The Team/Rep Opportunity Details table updates to show only matching opportunities.
This interaction lets you drill into the underlying opportunities behind each activity pattern.
Filtering opportunity details from the team and rep chart
Filtering the dashboard
The dashboard includes a collapsible filter panel so you can focus analysis on specific segments of opportunities.
Available filters include:
Date range
Filter opportunities by close date.
Team name
Analyze activity patterns for specific teams.
Opportunity type
Filter by opportunity type (for example: new business, existing business, or renewal).
Minimum and maximum opportunity value
Filter by minimum or maximum deal value.
All filters apply across the entire dashboard, updating metrics, charts, generative insights, and opportunity tables at the same time.